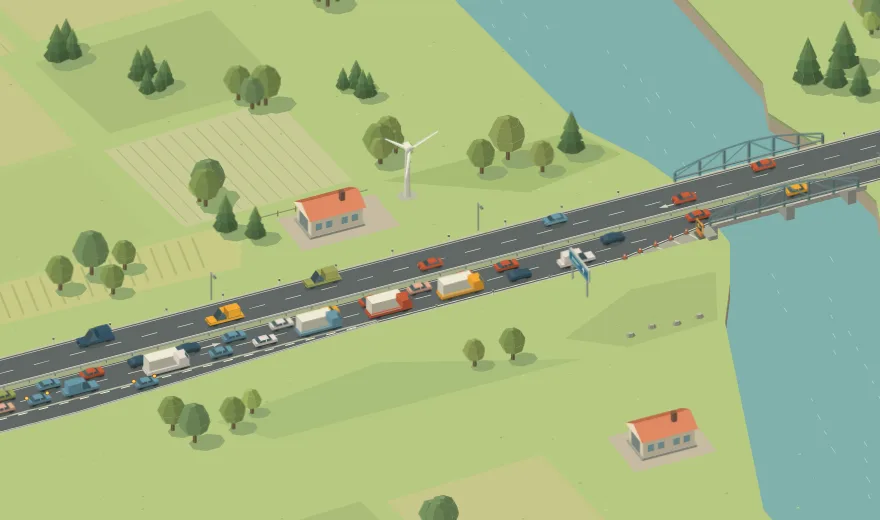
How many vehicles pass through one highway lane at 60, 80, 100 or 120 km/h?
At one single-lane work zone with an 80 km/h limit, researchers estimated a nominal capacity of 1,739 vehicles per hour. Comparable field measurements at 60, 100 and 120 km/h are missing.1
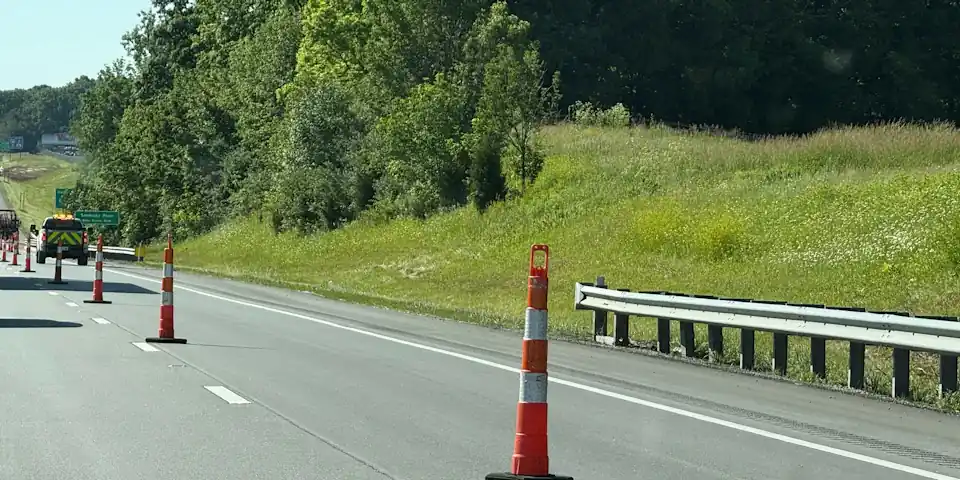
What researchers measured at a real work zone
At site NW 2012_805 in North Rhine-Westphalia, Germany, one 3.75-metre lane remained open. The road had a 3% uphill gradient and heavy vehicles made up 7.5% of traffic. The busiest observed hour saw 1,759 vehicles pass. The researchers used the 99th percentile of the hourly counts as the nominal capacity.1
Comparing speed limits requires similar measurement windows, lane widths, gradients and vehicle mixes. The road layout also matters: a continuous single lane has different merging conditions from a lane drop at a work zone.1
Four desired speeds at the same simulated bottleneck
The simulator keeps the layout and traffic demand fixed while changing the desired speed. The table shows the highest complete 60-second count for each setting. An hourly figure counts all exits over an entire hour.23
| Desired speed | Vehicles in 60 s |
|---|---|
| 60 km/h | 35 |
| 80 km/h | 35 |
| 100 km/h | 35 |
| 120 km/h | 35 |
Try it yourself
Compare the four desired speeds with the same demand and one open bridge lane. Watch the count for the previous minute.