
How do heavy vehicles and uphill gradients affect highway capacity?
In a 100 km/h example with four lanes in each direction, the HBS design capacity falls from 7,200 to 6,400 vehicles per hour as the heavy vehicle share rises from 10% to 30%. The manual also assigns lower capacities to steeper sustained climbs.1
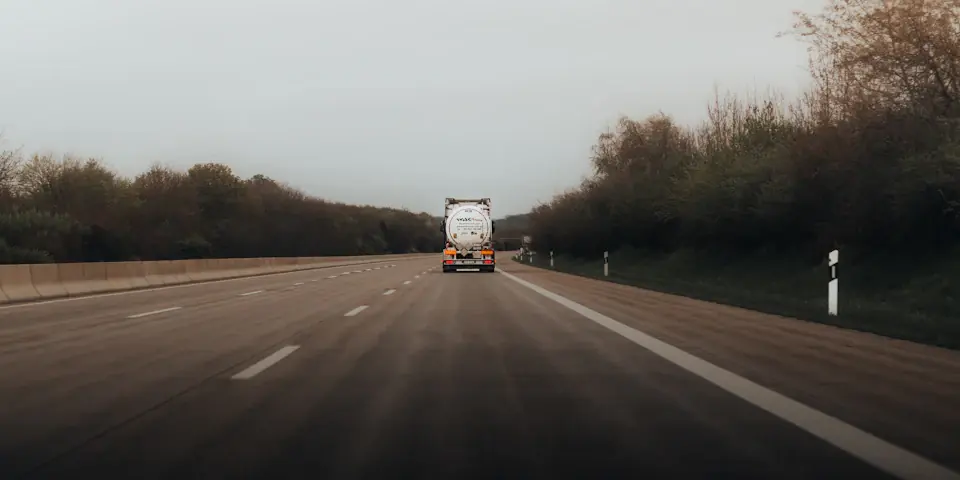
More heavy vehicles on the same road
This comparison keeps four regular lanes per direction, a location outside a metropolitan area, the speed category that includes 100 km/h, and a gradient of up to 2%. The table varies just the heavy vehicle share. The difference between 7,200 and 6,400 is 800 vehicles per hour in one direction, about eleven percent of the first figure. Another gradient or lane count takes its own row.1
| Heavy vehicle share | Veh/h per direction |
|---|---|
| ≤ 5% | 7,400 |
| 10% | 7,200 |
| 20% | 6,800 |
| 30% | 6,400 |
Steeper segments at the same heavy vehicle share
For four lanes outside a metropolitan area and 10% heavy vehicles, design capacity falls by 900 vehicles per hour per direction between a 3% and a 5% grade. The separate HBS table for climbs of at least 500 m uses no speed-limit categories.12
| Uphill grade | Veh/h per direction |
|---|---|
| 3% | 6,900 |
| 4% | 6,600 |
| ≤ 5% | 6,000 |
Test it in the simulator
Start with 40% trucks and compare throughput with a stream of mostly cars.