
Online traffic simulator
Does adding a lane ease traffic? Change the road layout and see how many vehicles get through.
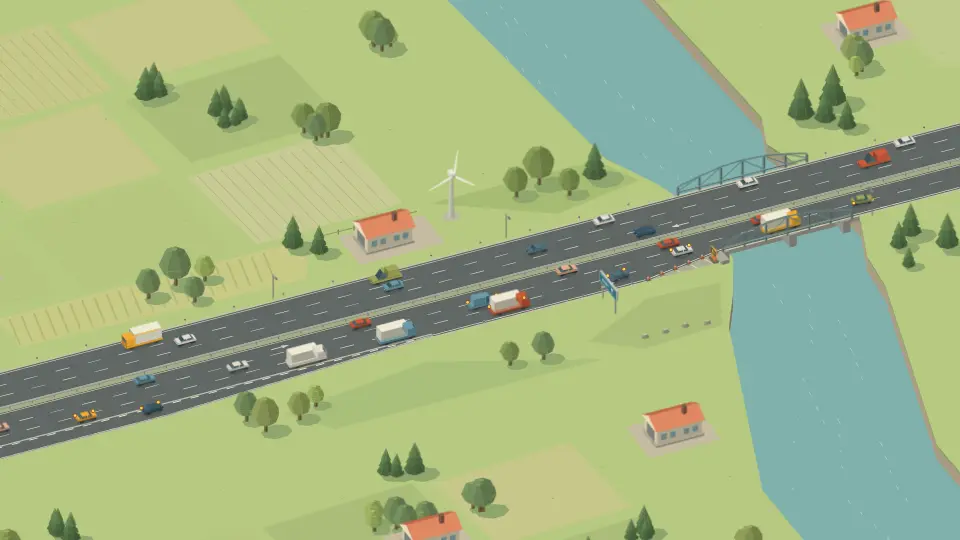
Drag or use the arrow keys to pan. Press Home for the overview, Enter to select vehicles, and Escape to clear the selection.
- Speed
- Attention
- Time lost since entry
First experiment
- Change the lane count in the control panel.
- Watch where traffic backs up.
- Compare two lane layouts with the same arrivals.
Switch the use of the outer lane to compare how many vehicles are waiting.
City traffic this run
- Premature junction entries
- –
- Cross-traffic waiting time
- –
- Junction blockage
- –
- Transit waiting time
- –
- Scheduled dwell time
- –
Entries and exits
last 60 seconds| Direction | In | Out |
|---|---|---|
| Towards bridge | – | – |
| Opposite direction | – | – |
Compare lane layouts
The first number is the lanes before the bridge, the second is the lanes on it. A starts with your current settings. Both layouts receive the same arrivals for five minutes.
| Measure | |||
|---|---|---|---|
| Throughput (veh/min) | |||
| Mean time in section per exit (s) | |||
| Peak queue (vehicles) | |||
| Exits in 5 min | |||
| Still upstream of exit at end (veh) | |||
| Time lost across all trips (veh·min) | |||
| Bus and tram waiting time (s) | |||
| Junction blockage (s) | |||
| Premature junction entries | |||
| Cross-traffic waiting time (veh·s) |
Mean travel time covers vehicles that exited. Time lost includes unfinished trips and waiting at entrances. One vehicle-minute is one minute lost by one vehicle.
The four Traffic Lab maps
The "Just one more lane, bro." meme inspired Traffic Lab. Change the lane count on the highway or in Bonn. On the other maps, test a short passing lane or compare a roundabout with traffic lights.
What do studies say about adding lanes?
-
A Japanese field trial used a climbing lane as a regular third lane before the road returned to two lanes. Traffic was spread more evenly across lanes. The change in capacity before queue formation was not statistically significant.
Moriyama et al. (2011) · Field trial on the Chūō Expressway -
At a lane drop near London, the flow measured after a queue formed was about ten percent lower than the flow immediately before it formed.
Bertini & Leal (2005) · Measurements at a freeway lane drop -
In simulations of two Houston freeway sections, a longer extra lane could improve traffic flow. When the next on-ramp was busy, traffic flowed better if the extra lane ended before it.
Qi et al. (2018) · Where to end an auxiliary lane
How do drivers merge in real traffic?
-
At three German work zones, lane changes moved closer to the lane drop as traffic volumes increased. The observations covered uncongested traffic.
Sümmermann (2012) -
In congested work zones, lane changes typically started below 30 km/h. At one site, following vehicles lost a median of about 5 km/h during the lane change.
Jiao et al. (2024) -
At a Dutch on-ramp, the mean time gap to the leader grew from 1.2 to 1.4 seconds in the ten seconds after insertion.
Van Beinum et al. (2018) -
German A5 detector data showed steady discharge near a bottleneck and traffic waves farther upstream. Individual stops were outside the scope of the measurements.
Treiber et al. (2000)
How many vehicles can the bottleneck handle?
Compare six lane drops at the same desired speed. The table shows how many vehicles got through in the busiest minute beyond the bridge.
| Approach | 1 lane | 2 lanes | 3 lanes |
|---|---|---|---|
| 2 lanes | 35−46% | — | — |
| 3 lanes | 38−61% | 72−27% | — |
| 4 lanes | 38−69% | 73−41% | 106−15% |
Darker orange means a larger loss compared with a highway that keeps its original width.
How was this measured?
Each speed and layout uses the same three vehicle sequences. Every run measures five minutes after a two-minute warm-up. Demand is 160 vehicles/min in each direction, driver attention is 80% and 12% of vehicles are trucks. Only bridge-bound exits count. Loss compares each narrowing’s peak minute with the peak for the same approach width continuing across the bridge.
Peak counts without a lane reduction (vehicles/min)
2 → 2: 65 · 3 → 3: 98 · 4 → 4: 124
Where does the simulation differ from real traffic?
The matrix above shows the busiest minute. To compare with research, we count vehicles in one direction for a full hour. We report the median of three runs with different vehicle sequences.
-
Four lanes without an on-ramp
At a desired speed of 100 km/h, 7,196 vehicles per hour cross the bridge. The German design capacity for a level motorway outside a metropolitan area with 12% heavy vehicles is 7,120. We calibrated the entry flow against that value (+1.1%). At 80 km/h the model falls 2.4% below it, and at 120 km/h it is 3.3% above. The slider sets a desired speed, while the handbook uses the posted limit.
BASt V 377, Table 2-6 (PDF) -
Two lanes narrow to one
At 80 km/h the simulated bottleneck carries 1,827 vehicles per hour. Measurements at one motorway work zone in North Rhine-Westphalia gave a capacity of 1,739. The model is 5.1% higher. The real site had a 3% uphill gradient and 7.5% heavy vehicles. The simulated road is level and trucks make up 12% of demand.
BASt V 378, Tables 5-1 and 5-2 (PDF) -
What changes with an on-ramp
With four lanes and a desired speed of 100 km/h, simulated flow drops from 7,196 to 6,941 vehicles per hour when 13% of demand enters via the ramp. The reference value of 7,120 applies to motorway segments outside the influence of junctions. The difference alone does not show what a real on-ramp costs in throughput.
Geistefeldt (2016), Section 2.2 -
Lane changes and stops before the bridge
In the model, a car takes 2.8 seconds to change lanes and a truck takes 3.6. At real work zones, Jiao and colleagues observed that most lane changes in dense traffic began below 30 km/h. That observation describes speed when a lane change begins. How often vehicles would have stopped earlier in the queue at a bridge like ours remains an open question.
Jiao et al. (2024), Figure 7