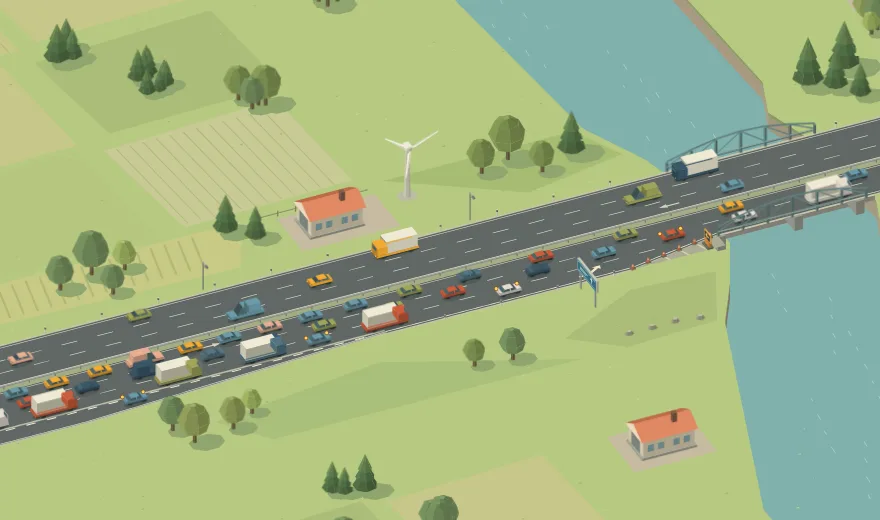
How do three-to-two and two-to-one lane drops compare?
At a desired speed of 80 km/h, 72 vehicles passed the two-lane bridge bottleneck in its busiest simulated minute and 35 passed the one-lane bottleneck.1
The difference in the model
The busiest minutes at the two bottlenecks differed by 37 vehicles. Each baseline keeps the same number of approach lanes open across the bridge.2
| Lanes | No lane drop | Lane drop | Change |
|---|---|---|---|
| 3 → 2 | 98 | 72 | −27% |
| 2 → 1 | 65 | 35 | −46% |
What other studies found
In a US work zone simulation by Beacher and colleagues, mean throughput was around 2,304 vehicles per hour for a three-to-two drop and 1,269 for two to one. These are averages across several settings with conventional US work zone traffic control.3
At a three-to-two lane drop on the UK’s M4, Bertini and Leal measured an average 9.7% lower outflow after the queue formed than immediately before it. The field study compared two phases at the same bottleneck.4
What the busiest minute does not show
The busiest minute is a snapshot. It says nothing about how many vehicles cross over a whole day or how long individual drivers wait. It is still a fair comparison between these two bottlenecks because both runs use the same approach and demand.
Try it yourself
Start both runs with the same traffic demand and a desired speed of 80 km/h. Compare the count at the end of the bridge and see how far each queue extends.