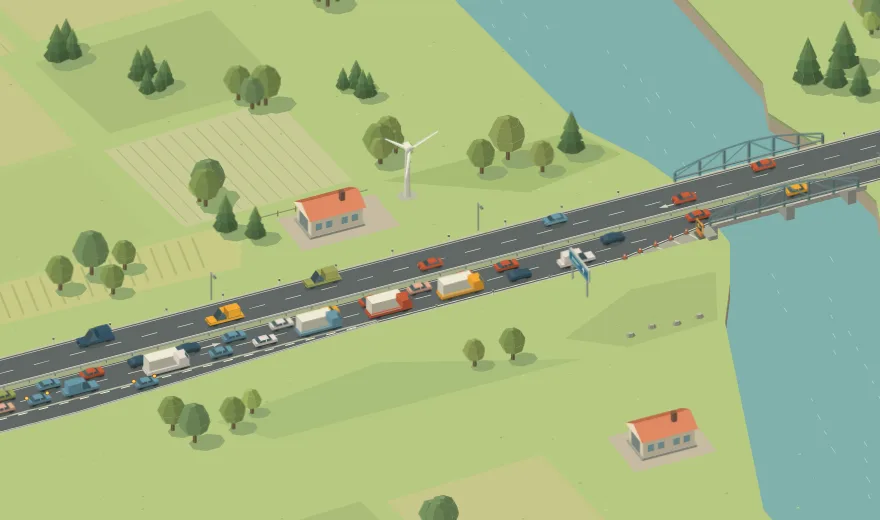
How much do extra approach lanes help when the bridge still has one lane?
At a desired speed of 80 km/h, 35 to 38 vehicles cross the one-lane bridge in its busiest simulated minute, depending on the approach. The highest and lowest counts differ by 3 vehicles.1
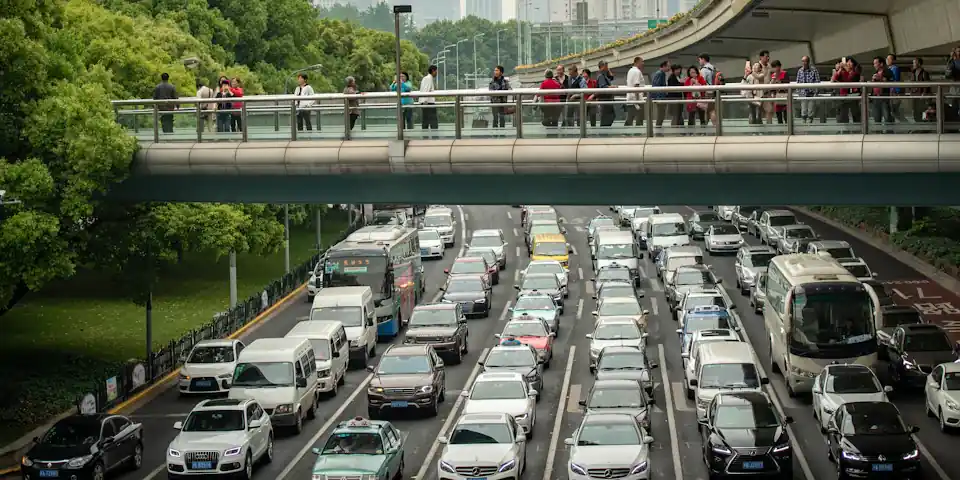
One bridge lane, three approaches
The bottleneck has the same width in all three layouts. The measurement changes the number of approach lanes and takes the busiest minute from 3 runs for each layout.2
| Approach → bridge | Vehicles |
|---|---|
| 2 → 1 | 35 |
| 3 → 1 | 38 |
| 4 → 1 | 38 |
What higher throughput means for delays
In a separate five-minute rush-hour test, eleven more vehicles exited with four approach lanes than with three. The vehicles that exited spent longer on the road segment on average, while the total time lost across all journeys in the measurement window fell. The two metrics count different groups of journeys.3
When comparing layouts, check how many journeys were unfinished as well as how many vehicles exited. The unfinished count in this test includes vehicles still waiting to enter at the end of the measurement window.3
Try it yourself
Keep one bridge lane open and test two, three and four approach lanes. Use the lane comparison for two layouts and check exits and time lost.