
Do more people cycle after a pop-up bike lane opens?
Cities that installed temporary bike lanes in 2020 counted more cycling afterwards. A study of 106 European cities estimates an increase of 11% to 48%, depending on the model. The counters see every passing bike, not every person.1
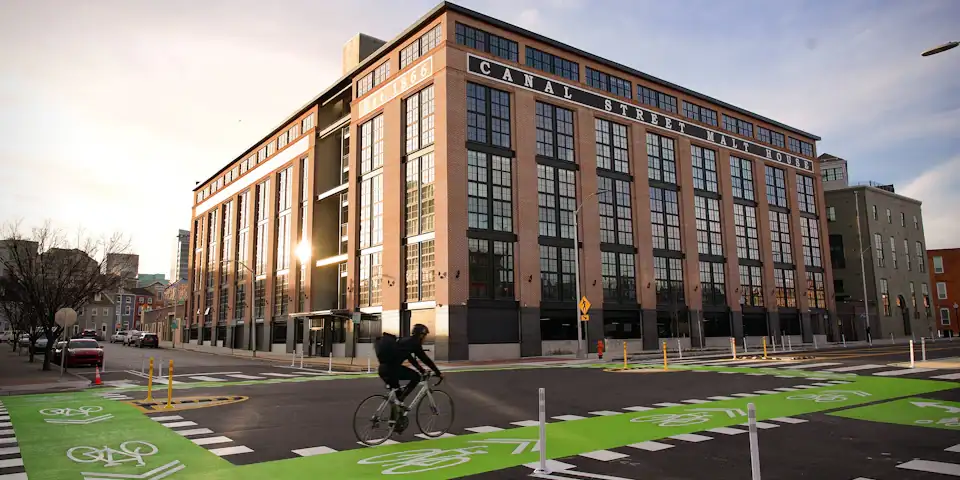
Separating the lane from the pandemic
Kraus and Koch collected data from 736 counters in 106 European cities. They compared cities with and without new lanes and factored in when each lane opened. That let them subtract the cycling increase in cities whose streets stayed the same. Weather and other influences sit in the models.1
What happened on Berlin’s Kottbusser Damm
Deutsche Umwelthilfe estimated 1,990 bike trips per day on Kottbusser Damm in 2019. With the new lane, the figure was about 2,783 from April 2020 to the end of 2021, a 40% increase. The street had no permanent counter, so the group scaled Strava records using counters elsewhere in Berlin.2
A rider who moves over from a side street adds as much to the Kottbusser Damm count as someone who leaves the car at home. The rise on this one street does not say how many car trips disappeared.
Test it in the simulator
In the city model, see how a reserved outer lane changes traffic.